 Accounting and Business Consulting
A quali-/quanti- tative look at FP&A cost

Intro:
This blog is a very short ‘what if’-type comment to show how FP&A overhead (fixed cost, performance appraisal type) can itself be analysed as a diminishing returns investment, making use of some of the modelling / questioning props that us Financial Planning & Analysis folk are fond of as reference points to back it up. I have deliberately focused on qualitative conjecture, only cursorily looking for hard data and not including any.
The ‘quanti-’ bit sneaks in because the online model I built outputs numbers depending on whatever inputs users plug in, not because this is an empirical analysis based on hard data. Numbers often help, even if they are fake.
With some context and narrative this model can help us to understand why a smaller firm might be happy to spend proportionately more on FP&A than a large firm (or vice versa), and it may also show how we can substantiate a financial argument with qualitative data when quantitative data is in short supply.
The below picture shows the graph produced from simply adopting the model’s default params (overwrite them as you wish) and pressing ‘Submit’. The default settings produce a curve of diminishing returns. The outputs include some helpful numbers and text.
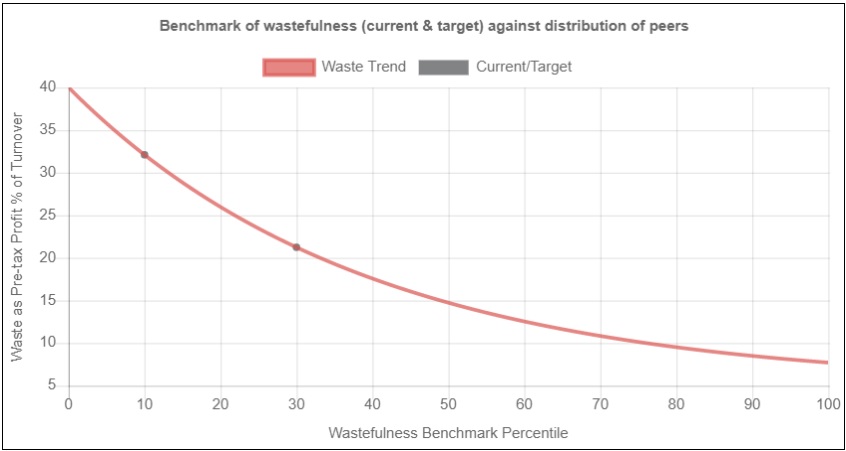
There are really only four important features of the model to draw your attention to:
- The y-axis measures financial loss associated with management deficiencies that arise from poor FP&A, and the x-axis measures how companies rank in effectiveness of their FP&A.
- Both axes are relative rather than absolute (y-axis is a percentage of turnover rather than turnover, and x-axis is a norm-referenced percentile distribution of a benchmarking scorecard).
- The model is equipped with functionality to increase the curvature of the exponential curve and to set an upper and lower bound of the y-axis. Ideally, the y-scale and curvature of the model would be agreed by all firms in the sector.
- Moving left to right from a low-performing percentile to a high-performing percentile is associated with a fall in financial loss as a percentage of turnover.
So how does it help us think about FP&A overhead? First we need some additional context relating to the nature of FP&A expenditure:
Types of FP&A:
FP&A work can be split into two categories: investment appraisal and performance appraisal.
Investment appraisal is focused on assessing one-off projects of defined time horizons with quite bounded risks and rewards associated with particular events or associated scenarios (such as winning a bid, winning approval for capex, or financing for a project).
FP&A cost for this type of work is variable and can be directly associated with the project, and capped accordingly.
Performance appraisal has to do with maintaining or gradually improving the steady state performance of a business, because it can take constant effort just to maintain a position which is a precarious equilibrium (just ask a surfer riding a wave or a tightrope walker on a rope).
The FP&A cost for this type of work is generally fixed, even if interspersed with occasional one-off consulting work to develop systems and processes.
In a broad market of thousands or tens of thousands of projects a statistical valuation could be placed on the volatile gains or losses of investment projects, but it would be impossible to infer the project value and associated FP&A cost applicable to a particular firm from this stochastic value, so the model will not apply.
In contrast, we assume that there is a consistent trend for performance appraisal where increased FP&A adoption results in increased management performances and lower FP&A-related financial losses due to excessive cost or opportunity losses from overlooked revenue opportunities.
So, now that we have the background and the curve, how does this open up our thinking on the topic of what is worthwhile FP&A expenditure?
Analysis:
An exponentially reducing curve is reflective of diminishing returns and getting the curvature materially correct is important is important for a number of reasons.
For example, in a diminishing returns curve a firm which moves from the 10th most wasteful percentile to the 20th most wasteful percentile benefits from a higher percentage waste reduction than a firm which rises from the 80th percentile to the 90th percentile and would be prepared to pay proportionately more to achieve the same percentile change.
This does not necessarily mean that FP&A spend is more dependent on the lower percentiles, because the curve is scale independent and large firms might be clustered in the higher percentiles. So, a smaller percentage expenditure by these firms could equate to or outweigh a higher expenditure by smaller firms which have not captured the same level of efficiency.
Also, the percentile ranking along the x-axis should be materially representative. Using a scorecard to score performance and then norm-referencing the scores into percentiles that are distributed evenly along the x-axis allows for qualitative data to substitute for hard data which may be harder to obtain.
Broadly, the score card might be expected to mirror known reality, e.g. for the manufacturing sector a few decades back, we might expect for Japanese Kaizen, zero defect, six sigma, JIT firms to be clustered in the higher percentiles and less efficient Western firms in the lower percentiles.
(However, if Western firms spent proportionately more on FP&A despite higher amounts of wastefulness, this could invalidate the assumption of FP&A’s correlation to efficiency and point to cultural or other organisational features playing a greater role in determining operational efficiency.)
Using the exponential curve also means that the firms in the top 50% are relatively more closely packed per percentage of financial wastefulness. This might be true if there is less (at least percentage-wise) separating firms at the more competitive edge of the wedge.
Note that the curve says nothing about the base overhead FP&A cost that exists per firm – two firms at the same percentile of performance would spend the same percentage of turnover to progress to the same higher percentile. This is the case no matter what the size and cost of their individual FP&A functions.
So, if the sector is competitive and FP&A is a real source of competitive advantage, then investing to make this function as cost-efficient and yet as powerful as possible would make a lot of sense – something which the curve ignores.
An alternative interpretation – that larger firms are proportionately more wasteful than smaller firms - can also be feasible. This is not unreasonable, because smaller firms have fewer variables and the line of sight from top management to any given event or ongoing process is quite direct, so waste is more visible even without FP&A overhead, and so more easily controlled.
But if this is true, then the pound value amount that large firms should be prepared to spend on FP&A to reduce waste can easily be very high, which begs the question of whether they are spending enough, or whether expenditure is failing to deliver the expected value.
In Conclusion:
This simple model, supported by some business background and perhaps some qualitative data, can facilitate a lot of conjecture and inferences which may help to focus attention on particular points where more needs to be known as a precursor to taking action.
Surprisingly, coming up with this kind of model presented more of a challenge than I expected because it was easy to become confused about what the axes should be, or how to reverse engineer the exponential curve, or what inferences and associations to draw from the resulting curve.
As is often the case, deriving what turned out to be a seemingly simple picture and process involved clearing away a lot of underlying complexity that got in the way. Practical use of the model with real data might quickly show that it would be a mistake to take its apparent simplicity as a sign of robustness, but it still has value as a launchpad for more thinking. The reward for FP&A intellectual horsepower is when the pieces click neatly into place and give rise to tools that do work with reality and dispel the fog of chaos - and that can be worth a lot.